Improving Bubble Evolution
Tailoring electrode architectures to improve bubble evolution
Motivation
Improving the performance of water electrolyzers involves not only enhancing the intrinsic activity of electrocatalysts but also optimizing extrinsic properties such as electrode shape, geometry, surface roughness, wettability, and surface area. These extrinsic properties are crucial as they influence the formation of gas bubbles, which increase ohmic interelectrode resistance and obstruct the catalyst’s active surface area, thereby reducing electrolyzer efficiency at high current densities. Understanding how these properties affect electrochemical performance and bubble formation is key to advancing water electrolysis.
My goal is to examine the influence of extrinsic and device-related properties on the performance of electrochemical energy devices using analytical techniques. I am particularly interested in studying the compounded effects of these properties on specific aspects such as bubble evolution, electrical resistance, mechanical degradation, and membrane deterioration.
Research Projects
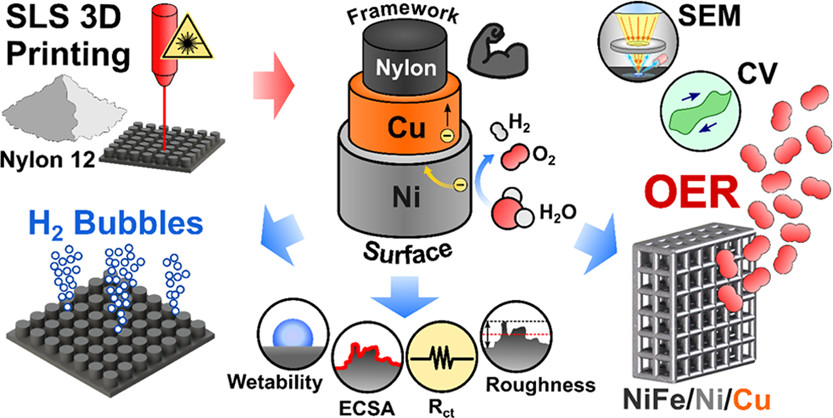
In this study, we examined the impact of extrinsic properties and electrode architecture on bubble removal during water electrolysis (Figure 1). Utilizing 3D printing, we customized the electrode architecture into various shapes to examine their effects on performance.

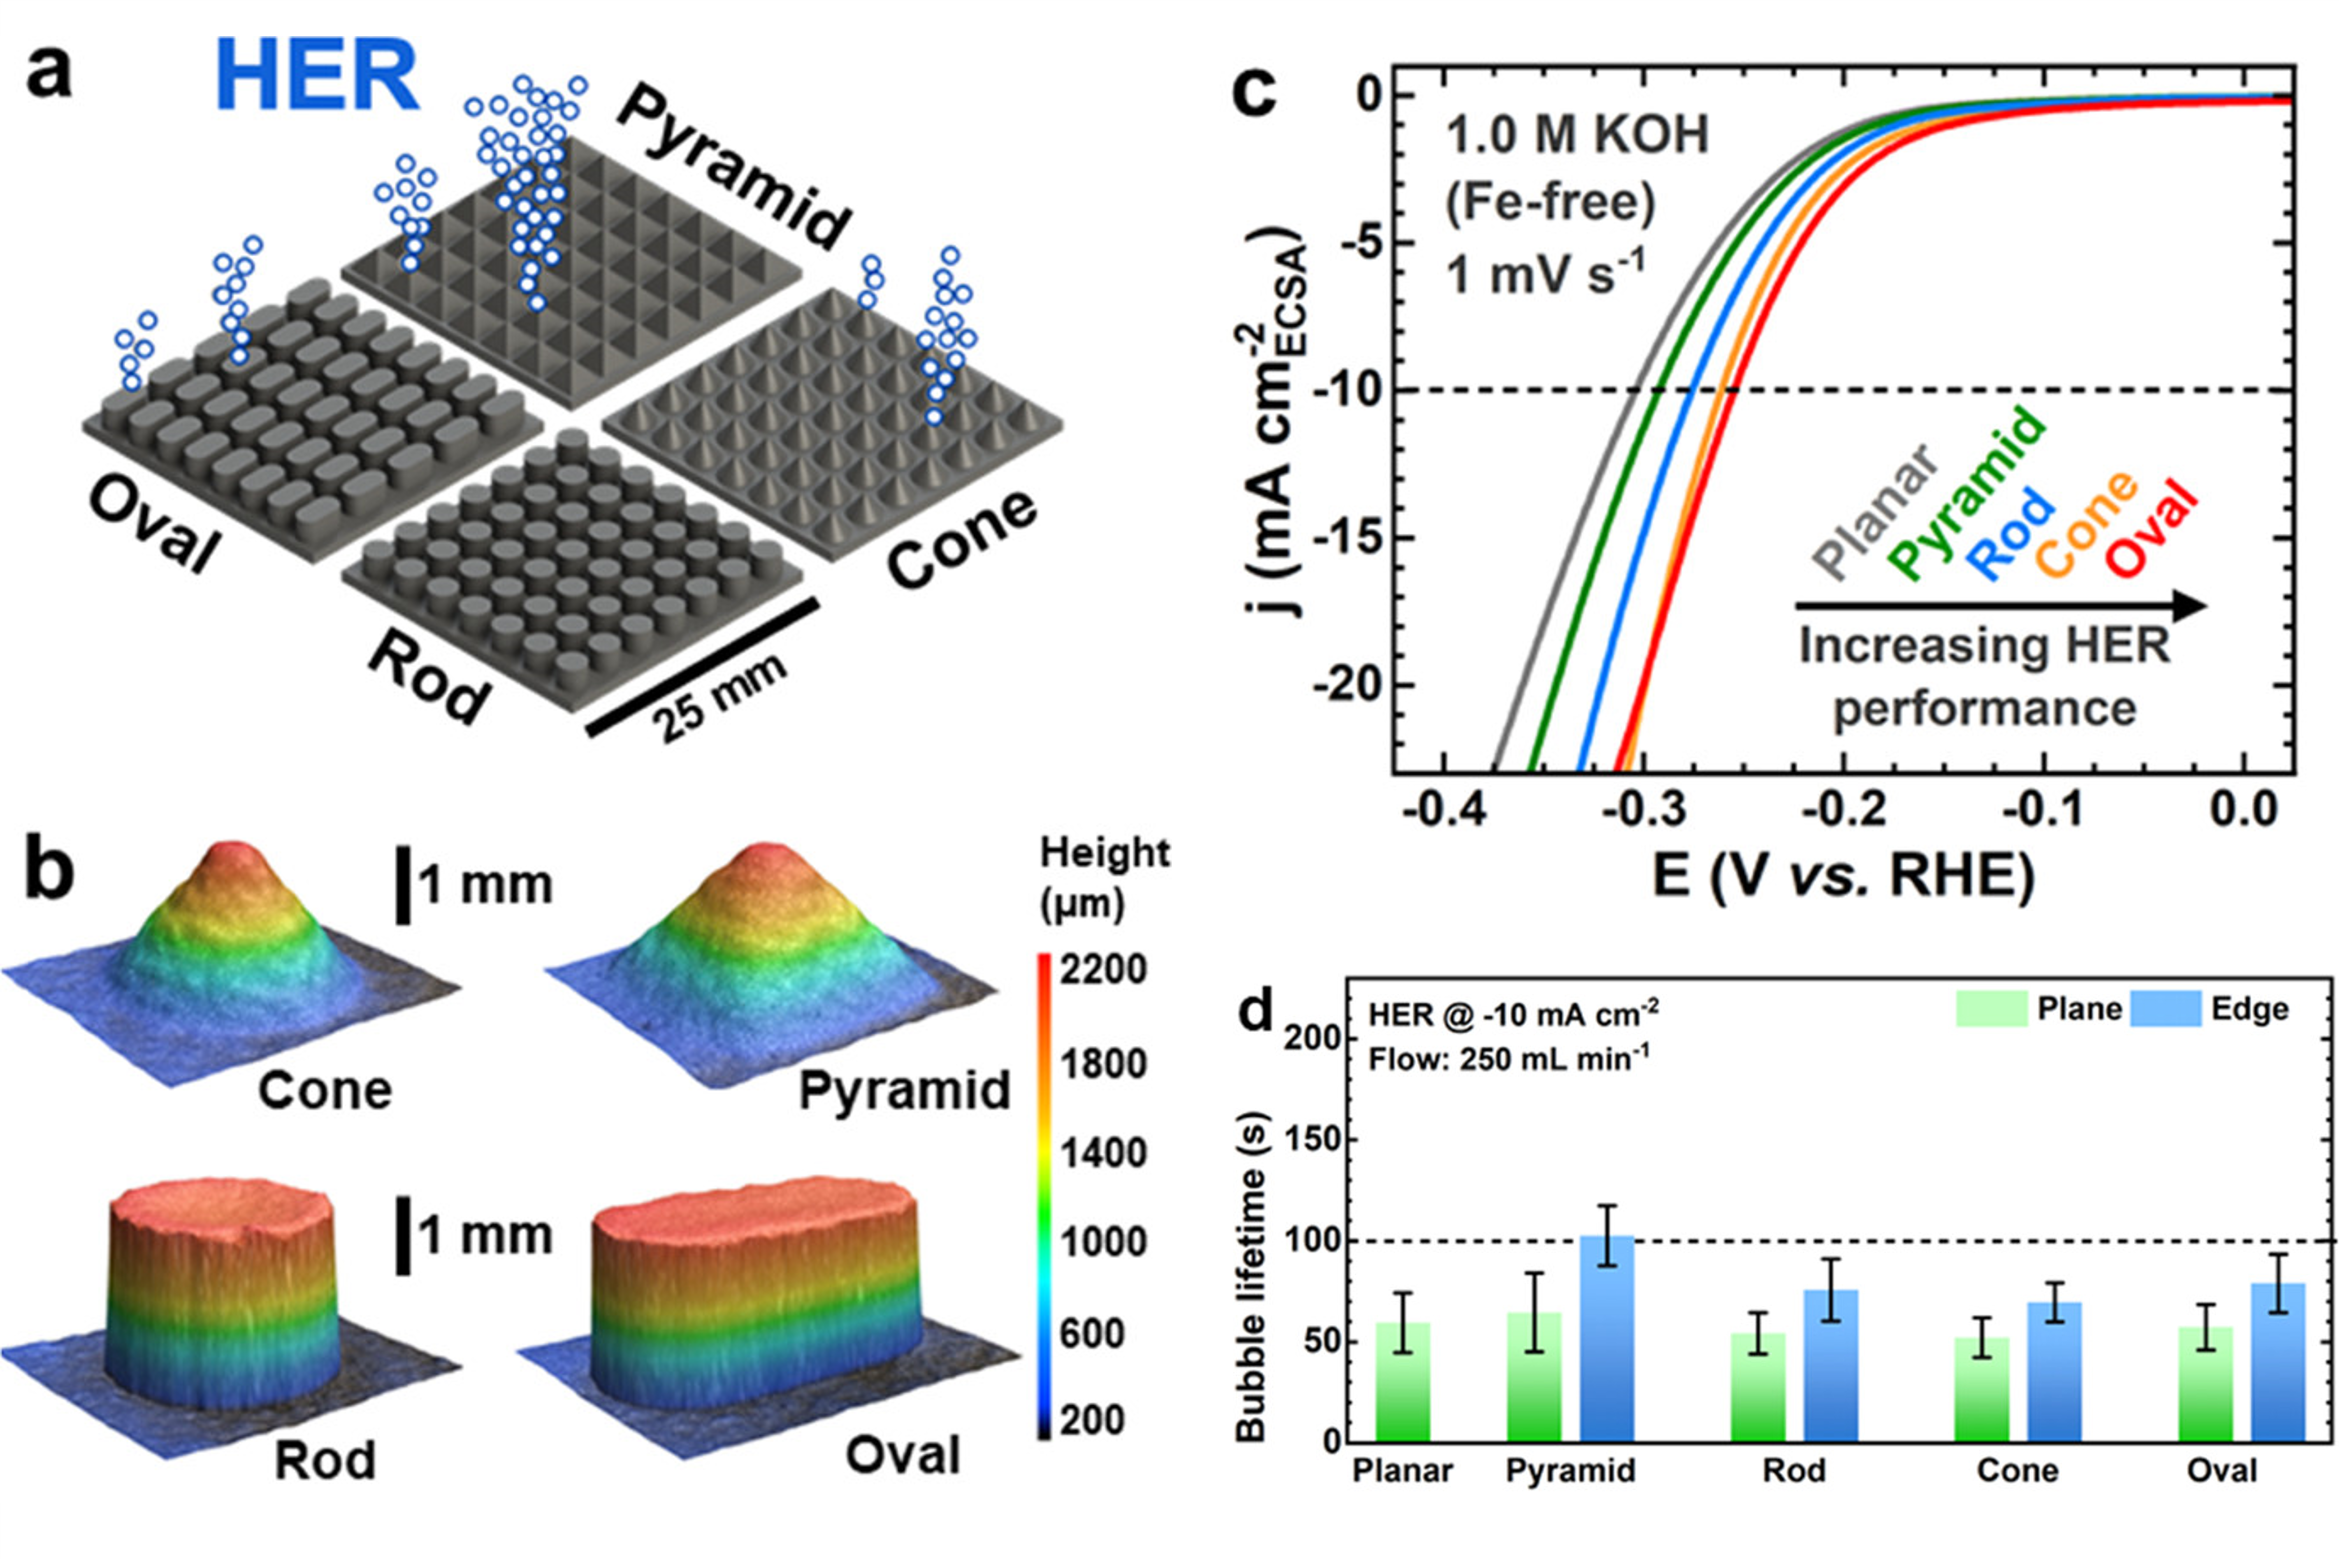
We observed that different electrode geometries significantly influenced the electrochemical performance of the hydrogen evolution reaction and that bubble size varied between edge and basal planes on these geometries (Figure 2).

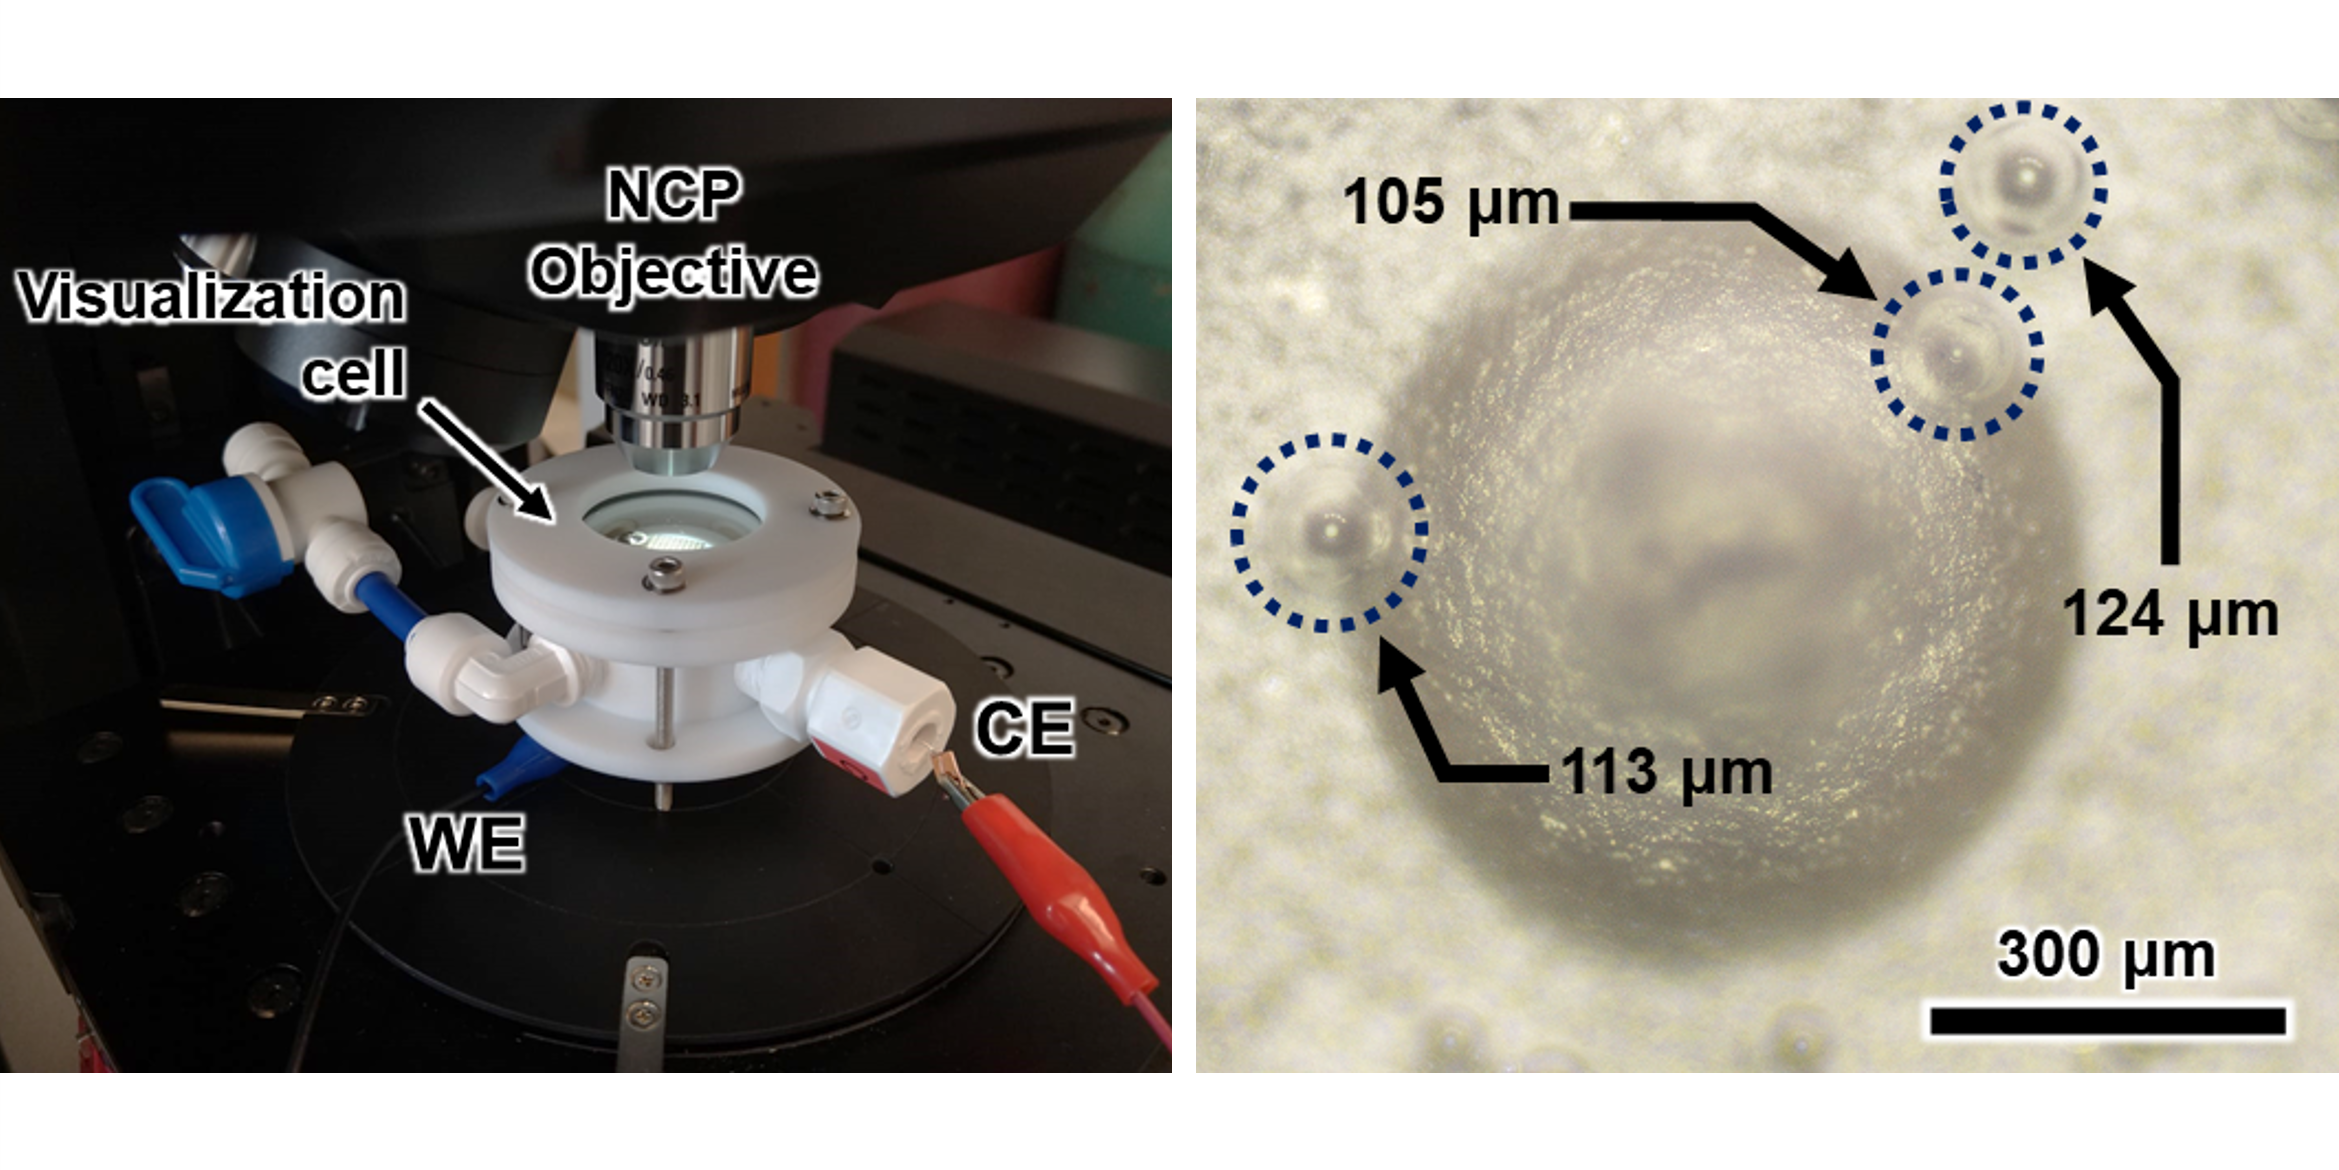
We conducted real-time examinations of bubble evolution using optical microscopy within a custom-built visualization flow cell (Figure 3). This setup allowed us to establish relationships between electrode geometry and bubble size distribution, providing valuable insights into optimizing electrolyzer design.
